
Have you ever walked out of a grocery store, looked at your receipt, and wondered how a few ordinary items could possibly cost that much?
You didn’t buy anything extravagant. You bought eggs, vegetables, coffee, chicken, and a few household essentials.
Yet your grocery bill looks noticeably different from what you remember paying a few years ago.
It isn’t just your imagination.
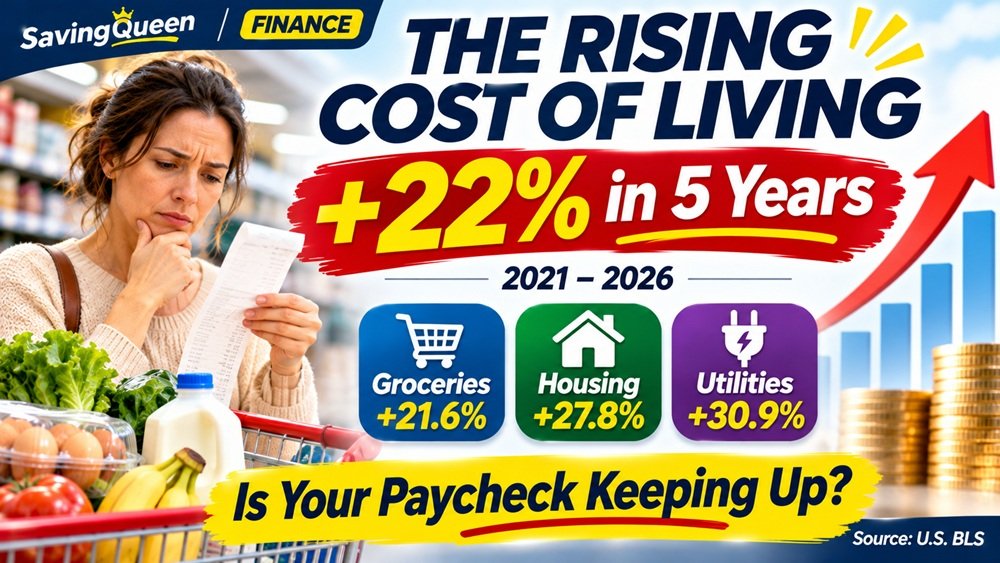
On November 19, 2026, the U.S. Bureau of Labor Statistics (BLS) released data showing that consumer prices increased 22% between October 2021 and October 2026.
And several essential household expenses increased even more.
For many American families, the financial challenge is no longer simply surviving a period of high inflation. It’s learning how to manage a household budget in a world where everyday prices have become permanently more expensive unless those prices actually decline.
1. How Much More Expensive Has America Become?
The latest five-year Consumer Price Index (CPI) data reveal significant differences across spending categories.
| Spending category | Five-year price change |
|---|---|
| Energy | +33.2% |
| Gasoline | +31.9% |
| Fuels and utilities | +30.9% |
| Shelter | +27.8% |
| Dining out | +27.8% |
| Housing | +26.8% |
| Food | +24.0% |
| Transportation | +22.9% |
| Overall consumer prices | +22.0% |
| Groceries | +21.6% |
| Education | +17.5% |
| Recreation | +15.4% |
| Medical care | +12.9% |
| Clothing | +11.4% |
| Communication | −3.7% |
| Smartphones | −51.2% |
Source: U.S. Bureau of Labor Statistics, October 2021–October 2026, CPI-U, not seasonally adjusted. Some categories overlap and should not be added together.
How Much Have Everyday Prices Increased?
U.S. consumer prices | October 2021 – October 2026
What stands out is that many of the biggest increases involve expenses that households cannot easily avoid.
You can postpone buying a new smartphone. You can wear the same clothes for another year.
But you still need somewhere to live, groceries to eat, electricity, and transportation.
That difference helps explain why inflation can feel particularly painful, even when some consumer products become less expensive.
2. Why Lower Inflation Doesn’t Mean Lower Prices
One of the most common misunderstandings about inflation is the belief that when inflation slows down, prices return to their previous levels.
That’s not how inflation works.
Imagine a weekly grocery basket that originally costs $100.
| Situation | Grocery bill |
|---|---|
| Original price | $100.00 |
| After a 10% increase | $110.00 |
| After another 3% increase | $113.30 |
| After another 2% increase | $115.57 |
Inflation has slowed from 10% to 3% and then to 2%.
But the grocery bill has continued to increase.
This is called disinflation: prices are still rising, but more slowly.
Actual price declines are different. When prices broadly fall, economists call that deflation.
Understanding this distinction explains why consumers sometimes feel disconnected from encouraging inflation headlines.
A slower inflation rate may be good news for the economy, but it doesn’t erase the price increases that households have already experienced.
3. What Happened to the Purchasing Power of $100?
A cumulative inflation increase of 22% means that a representative basket of goods and services costing $100 in October 2021 would cost approximately $122 in October 2026.
| October 2021 purchasing cost | October 2026 equivalent |
|---|---|
| $100 | $122 |
| $500 | $610 |
| $1,000 | $1,220 |
| $3,000 | $3,660 |
| $5,000 | $6,100 |
| $50,000 | $61,000 |
Conversely, $100 today has approximately $81.97 of October 2021 purchasing power, based on the overall index.
That’s a loss of about 18% in purchasing power.
Notice that prices rising 22% does not mean purchasing power falls by exactly 22%. The calculation works in reverse: $100 divided by 1.22.
This is particularly important for retirees, households with fixed incomes, and workers whose earnings have not kept pace with inflation.
4. A Realistic Household Budget: Then vs. Now
National statistics can seem abstract until you translate them into monthly household expenses.
Consider a household that spent $1,000 per month on four everyday expense categories in 2021.
Applying the corresponding five-year BLS price changes produces the following illustrative comparison.
| Monthly expense | 2021 budget | 2026 equivalent | Increase |
|---|---|---|---|
| Groceries | $500.00 | $608.00 | $108.00 |
| Dining out | $200.00 | $255.60 | $55.60 |
| Fuels and utilities | $150.00 | $196.35 | $46.35 |
| Gasoline | $150.00 | $197.85 | $47.85 |
| Total | $1,000.00 | $1,257.80 | $257.80 |
The additional cost would be approximately:
- $258 per month
- $3,094 per year
And this example doesn’t include rent, mortgage expenses, insurance, childcare, or other major bills.
These figures are hypothetical, calculated using national CPI category changes. Actual household expenses depend on location, consumption, product choices, and individual circumstances.
Nevertheless, the example illustrates something important.
A family can maintain essentially the same lifestyle and still spend thousands of dollars more each year.
5. Why Your Personal Inflation Rate May Be Higher Than 22%
The CPI measures price changes using a representative pattern of consumer spending. It does not measure the exact experience of every household.
Consider three different families.
A renter: A large share of monthly income goes toward rent. Rising housing costs may have an especially significant impact.
A homeowner with a fixed-rate mortgage: Principal and interest payments may remain unchanged, but insurance, property taxes, repairs, and utilities can become more expensive.
A commuter: Someone who drives long distances may feel fuel-price increases more strongly than someone who works from home.
Each household experiences inflation differently.
It’s also important to understand that the CPI shelter index includes rental measures and estimated rental values for owner-occupied housing. It does not directly measure home sale prices or mortgage payments.
The national shelter increase of 27.8% therefore does not mean every American homeowner or renter experienced that exact increase.
Your bank statements are often the best starting point for understanding your personal financial experience.
6. Did Your Paycheck Keep Up With Inflation?
A salary increase feels encouraging, but its real value depends on what happened to prices.
Suppose you earned $50,000 annually in October 2021.
Based on the cumulative CPI increase, you would need approximately $61,000 in October 2026 to maintain the same general purchasing power.
| 2021 annual salary | Inflation-adjusted 2026 equivalent |
|---|---|
| $35,000 | $42,700 |
| $50,000 | $61,000 |
| $65,000 | $79,300 |
| $80,000 | $97,600 |
| $100,000 | $122,000 |
Now imagine your salary rose from $50,000 to $57,500.
That’s a 15% raise, but it remains below the 22% cumulative price increase.
After inflation, your purchasing power would be approximately 5.7% lower than in 2021.
This doesn’t necessarily mean you’re financially worse off in every respect. Your taxes, benefits, debts, household size, and savings may also have changed.
But it shows why nominal income growth and real income growth are not the same thing.
7. Why Cutting Out Coffee May Not Solve the Problem
Personal finance advice often focuses on small discretionary purchases.
Cancel a streaming service. Stop buying coffee. Eat out less frequently.
Those suggestions can be useful, but they sometimes overlook the largest financial pressures facing households.
A $35 monthly subscription is worth reviewing.
However, a $250 increase in essential monthly expenses creates a much bigger problem.
Suppose your monthly spending has increased by $250.
Canceling a $15 subscription would reduce the increase to $235. It helps, but most of the financial pressure remains.
This is why a household budget review should begin with larger recurring expenses.
Examine your housing costs, insurance premiums, transportation, groceries, and utility bills before focusing exclusively on occasional small purchases.
Reducing unnecessary expenses matters, but so does recognizing when the underlying cost structure of your household has changed.
8. Five Practical Ways to Respond to Higher Living Costs
Review your recurring bills
Set aside time to compare your current insurance, internet, mobile phone, and other recurring bills with available alternatives.
When comparing insurance policies, maintain appropriate coverage rather than switching based on price alone.
Even a $25 monthly reduction represents $300 in annual savings.
Compare grocery prices by usable quantity
A lower unit price is only valuable if you actually consume the product.
Before purchasing large packages, consider storage space, expiration dates, and how much food your household typically uses.
Buying six items at a discount is not economical if you throw three away.
Separate spending increases from price increases
Your grocery bill may be higher because prices increased, because you purchased more, or because you changed the types of products you buy.
Compare similar quantities whenever possible.
This helps distinguish inflation from changes in your own spending habits.
Build a realistic emergency fund
If your essential expenses have increased, your previous emergency savings target may no longer be sufficient.
For example, if monthly necessities increased from $3,000 to $3,600, a three-month emergency fund would rise from $9,000 to $10,800.
Emergency savings targets should reflect current expenses, not outdated budgets.
Protect your savings contributions
When expenses increase, retirement contributions and emergency savings are often among the first things households reduce.
However, repeatedly postponing savings can create larger long-term financial problems.
Review whether you can preserve affordable automatic contributions while adjusting other expenses.
If your employer offers a retirement plan match, consider its value when deciding how to allocate your available income.
9. Calculate Your Own Five-Year Cost Increase
You don’t need complicated economic software to understand how your household finances have changed.
Start by collecting your bank statements, credit card records, rent notices, and utility bills from 2021 and 2026, where available.
Complete a comparison like this:
| Expense | 2021 monthly cost | Current monthly cost | Difference |
|---|---|---|---|
| Housing | $_____ | $_____ | $_____ |
| Utilities | $_____ | $_____ | $_____ |
| Groceries | $_____ | $_____ | $_____ |
| Transportation | $_____ | $_____ | $_____ |
| Insurance | $_____ | $_____ | $_____ |
| Medical expenses | $_____ | $_____ | $_____ |
| Other expenses | $_____ | $_____ | $_____ |
| Total | $_____ | $_____ | $_____ |
To calculate the percentage increase in your monthly expenses:
(Current expenses − Original expenses) ÷ Original expenses × 100
For example, if monthly spending increased from $3,500 to $4,400:
($4,400 − $3,500) ÷ $3,500 × 100 = 25.7%
Your household spending increased 25.7%, compared with the national CPI increase of 22%.
However, this is a personal spending-growth measure, not a pure inflation index. It also captures changes in consumption, household circumstances, and purchasing decisions.
The distinction matters, but the result still helps you understand how much more income your current lifestyle requires.
10. Save or Skip: Which Adjustments Actually Make a Difference?
When living costs rise, it can be tempting to chase every discount.
But meaningful savings often come from changes that can be repeated throughout the year.
Consider this hypothetical monthly savings plan.
| Budget adjustment | Monthly savings | Annual savings |
|---|---|---|
| Reduce grocery waste | $40 | $480 |
| Renegotiate recurring bills | $25 | $300 |
| Reduce unnecessary dining-out expenses | $60 | $720 |
| Compare insurance and find equivalent coverage at a lower price | $35 | $420 |
| Reduce unused subscriptions | $15 | $180 |
| Potential total | $175 | $2,100 |
These aren’t guaranteed savings. They are examples of how several manageable changes could work together.
SAVE: Recurring expenses that can be reduced without sacrificing essential coverage, health, or quality of life.
SKIP: Purchases made simply because they are advertised as discounts, excessive bulk buying, and using rewards as an excuse to spend more.
PRIORITIZE: Financial decisions that improve your household’s position every month rather than producing only a one-time saving.
11. What the Smartphone Price Decline Really Means
One surprising figure in the BLS report is that the smartphone price index declined 51.2% over five years.
That doesn’t mean the latest premium smartphone necessarily costs half as much as it did in 2021.
The CPI accounts for changing product features and quality, including technological improvements.
Consumers may receive more computing power, better cameras, and improved functionality for their money.
But technological improvements cannot directly offset your rent or grocery bill.
For someone who buys a smartphone every four years, falling technology prices may have relatively little influence on monthly financial pressure.
That is another reason the overall inflation figure may not fully reflect how your household feels about rising living costs.
The Bottom Line: It’s Time to Budget for the Prices We Have Today
There is a certain frustration in paying $100 for groceries that once cost $80.
You remember the old prices. You know what your money used to buy.
But your household budget cannot remain anchored to the prices of five years ago.
The latest BLS data provide a useful reminder: many American families are adjusting not just to temporary price increases, but to a substantially higher overall price level.
That doesn’t mean you have to accept every rising expense without question.
Compare prices. Review contracts. Reduce waste. Protect your savings. Advocate for income growth where possible.
And most importantly, build your household budget around today’s financial reality.
Financial progress isn’t always about spending less than you did five years ago. Sometimes it’s about making better decisions with the money you have today.
Frequently Asked Questions
Did U.S. prices increase 22% in 2026 alone?
No. The 22% figure represents cumulative consumer price growth between October 2021 and October 2026.
How much did grocery prices increase over those five years?
The BLS food-at-home index increased 21.6% over the period.
Why do prices remain high when inflation slows?
Slower inflation means prices are increasing at a reduced rate. It does not necessarily mean prices are falling.
Does the 22% inflation figure apply to every household?
No. Individual experiences vary depending on housing, transportation, consumption patterns, location, and other circumstances.
How much income would replace $50,000 of 2021 purchasing power?
Approximately $61,000 in October 2026, based on the overall CPI increase and before considering changes in taxes or benefits.
Will grocery prices return to their 2021 levels?
Individual products may become less expensive, but a slowdown in inflation does not guarantee that overall grocery prices will return to their previous levels.
Official Sources and Helpful Tools
- BLS — Five-Year Consumer Price Changes, November 19, 2026
- BLS — October 2026 Consumer Price Index Report
- BLS — CPI Inflation Calculator
- BLS — Consumer Price Index Frequently Asked Questions
- CFPB — Assess Your Spending
Last reviewed: November 20, 2026. All household budget, income, and savings scenarios are illustrative. This article provides general financial education rather than individualized financial advice.